TL;DR: Using the Strava API, SQL and Grfana to download and explore training data. This blog post is a walk through of various decisions I made and why throughout this mini-project. More comprhensive usage and setup instructions are on the README of the GitHub repo here.
Why another dashboard?
This project was inspired by a few things. The first was a constant longing for more graphs and visualisations of data on the sports tracking app Strava. The app (which I’ve been a user of since its early days in 2013) has recorded almost every single run and cycle I have ever done - tracking each pedal stroke, step and heartbeat for over a decade. With this huge wealth of data, I’ve always felt more could be done.
Predictably, I was not the first to have this thought, and there are plenty of free and proprietary options for visualising your training data. A friend and I used to use Elevate by Thomas Champagne many years ago, which displays more data than I had in more ways than I could ever want. And because I’m an engineer at heart, I wanted to see if I could build something similiar, but different, using Elevate as a template. I’d like to state for the record here that I am a big fan of Elevate and would recommend it to anyone, and it’s a much classier tool than anything I could achieve, but everyone needs something to aim for, right?
While working as a placement student in an RSE group during my PhD I came across Grafana - an extensible dashboard tool for data visualisation. Grafana can be used to display data from an SQL (semantic query language) database. Where Grafana really shines is its display of time-series data where a time span and refresh rate can be set to display data in a “live” sense from an updating SQL database. We were using it to display power data from Power Distribution Units (PDUs) in a supercomputer, but it can be used for any sort of time-series data, such as runs or cycles over a period of time.
The idea then was to use Grafana to create a dashboard of training data that I could manipulate to display whatever I liked. Additionally, I wanted to improve my OOP (object-oriented programming) in Python and play around with the Strava API for no other reason than I thought it would be fun. So I set off to make a Elevate-esque visualisation tool combining Grafana, Python, SQL and the Strava API.
To keep this blog brief, I will try not to re-cover the installation instructions or usage instructions already present on the README of the GitHub repo or if there are resources already available that I can point to. Instead I will mostly just cover why I made certain decisions.
Welcome to yet another sports data visualisation dashboard.
The Strava API
Maybe the first time I got a taste of the power of programming, I wrote a powershell script on my laptop that used curl to to download NASA’s “Astronomy Picture of the Day” using their API. It then saved it as my desktop background and then deleting the previous days picture. I’ve had a mild, child-like giddiness around APIs since because it usually brings back the same feeling of play and possibility. I’m sure every software engineer has a similiar story. When I found out Strava had an API, I needed to give it ago. For obvious reasons surrounding data privacy, this one was a lot more unweildly than NASA’s picture of the day.
Authentication
The documentation for getting started can be found on the developers website. It’s quite an involved process but eventaully you will have an authentication token, refresh token and a time when the refresh token runs out. When that time passes, you can use the refresh token to obtain a new authentication token. That token is used for every API call, so it needs to be kept safe. After a few iterations of keeping it in a text file and using some awkward command line arguments to edit that file, I settled on using the dotenv Python package to manage a .env file with those tokens in it. Then I added this to my .gitignore file so I wouldn’t accidentally push it to my public repository.
MySQL
The choice between MySQL and SQLite was more of a flip of the coin. The main difference between the two being that SQLite is serverless. I honestly wasn’t sure in the beginning how much data I was going to be downloading but the potential is for quite a lot so I played it safe and went for MySQL. The other reason for using MySQL was that Grafana works out-the-box with a MySQL server, whereas (to my knowledge), additional plugins are needed for SQLite. For details on adding the MySQL server as the backend for the Grafana instance, follow the README on my repository.
Having decided on the software, I then created the following table called activities in a database called test (inventive, I know), and this I could edit from a Python script with an api_user and a combination of pymysql and sqlalchemy. I would have stuck to a single Python package for the MySQL interface, but as with all side-projects done on weekends that were not desgined from the ground up, this became a bit of a Frankentein’s Monster. The credentials for the api_user were also stored and and read-in using the .env file.
mysql> describe activities;
+-------------+-------------+------+-----+---------+----------------+
| Field       | Type        | Null | Key | Default | Extra          |
+-------------+-------------+------+-----+---------+----------------+
| id          | int         | NO   | PRI | NULL    | auto_increment |
| sid         | bigint      | YES  |     | NULL    |                |
| type        | varchar(50) | YES  |     | NULL    |                |
| date        | date        | YES  |     | NULL    |                |
| moving_time | int         | YES  |     | NULL    |                |
| distance    | float       | YES  |     | NULL    |                |
| elevation   | float       | YES  |     | NULL    |                |
| avg_speed   | float       | YES  |     | NULL    |                |
| avgHR       | int         | YES  |     | NULL    |                |
| maxHR       | int         | YES  |     | NULL    |                |
| stress      | int         | YES  |     | NULL    |                |
+-------------+-------------+------+-----+---------+----------------+
11 rows in set (0.01 sec)
The Activities
The Elevate app is a amazing, but it has a hefty installation process; literally downloading every byte of data Strava has on all of your activities, and given the API is throttled to limit you to a certain number of calls every 15 mins and a certian number per day, it can take many hours to actually download all of your data. I thought all that data might be overkill for my purposes so I selected only a few of the fields available, that I felt were most representative of an activity. The fields and their format can be found in the above table.
Most of the fields I chose are self-explanatory. The ones that aren’t are sid, which is the Strava ID number (the unique number given to every Strava activity and useful for tracking and removing duplicate activities), and stress, which represents the Training Stress Score (TSS) for each activity. This value is calculated by measuring the amount of time spent in certain heartrate zones and transalting this into a score that describes the amount of stress to your body. This score forms the foundation of the next section.
Fitness, Fatigue and Form
One of the most intriguing parts of this project (and the part I was most excited to replicate) was the fitness, freshness and form graphs that you see on all major sports tracking apps (Strava, Suunto, Training Peaks, to name a few). These graphs display three lines that rise and fall according to your apparent fitness, fatigue, and form, (for some obfuscated definition of fitness, fatigue and form) calculated using heartrate data or percieved efforts from your activities. These are calculated using 2 very simple weighed exponentials, where for each day $i$,
$$ fitness_i = fitness_{i-1} + \frac{TTSS_{i} - fitness_{i-1}}{42},$$ $$ fatigue_i = fatigue_{i-1} + \frac{TTSS_{i} - fatigue_{i-1}}{7},$$ $$ form_i = fitness_i - fatigue_{i-1}, $$
where $TTSS_{i}$ is the total training stress score for each of day (summing multiple activities TSS score in a single day). Find out more by following the links for Fitness, Fatigue and Form. These formulas are the pretty trivial to transalte into a Python script which can calculate your fitness for every single day for as far back as your first activity recorded in the activities table. These values can then be stored into the following table (also in the ’test’ database), called fitness. Instructions for creating both tables are on the README.
mysql> describe fitness;
+---------+-------+------+-----+---------+-------+
| Field   | Type  | Null | Key | Default | Extra |
+---------+-------+------+-----+---------+-------+
| date    | date  | NO   | PRI | NULL    |       |
| stress  | float | NO   |     | 0       |       |
| fitness | float | NO   |     | NULL    |       |
| fatigue | float | NO   |     | NULL    |       |
| form    | float | NO   |     | NULL    |       |
+---------+-------+------+-----+---------+-------+
5 rows in set (0.00 sec)
The Generic Activities
One of the other reasons I wanted to build this was because I’m actually quite lazy. Outside of running and cycling, I also go to the gym, climb and very occasionally box. These sports don’t really have distances (and therefore no maps) and I don’t tend to wear a heartrate monitor for them either. So, there’s not anything to track and upload, other than time, for these activities, and I wouldn’t wear my Suunto watch that I use to track everything else - it’s generally not sensible to box or climb with a watch on. I could, of course, manually upload these activities on Strava, but afformentioned laziness is a natural barrier to this process.
Having these activities was also much more preferable than not having them. I used to go to the gym most days (emphasis on used to) and all of that accumulated TSS was going unrecognised in my fitness, fatigue and form graphs. This meant that I was missing out on my “true” values for those metrics.
What I wanted, then, was a lazy-proof method of adding these activities without me really having to think too hard. My solution to this was to create a script that would ask me, for each given day since the last sync, what activities I did that day and add them for me. Thankfully, because I am a creature of habit, I was able to assume that my activities were all pretty much the same length (in time) and intensity and so I was happy to assume that roughly, every activity of a particular category is identical.
My implementation was to have a Python script that would loop through each day since the last sync, then prompt me, in the terminal, to enter the name of the activity I had done that day. The value entered into the terminal would then be parsed in the script and the relevant activity selected from a predefinied JSON file with a time and TSS (both fictional but representative of a normal session) and then added to the table of activites in the MySQL database. In the event that I didn’t do a session on that day, I could return a blank entry and the nothing would be added for that day. Eventually, it looked something like this:
c1616132@Latitude-5410:~/Documents/straviz/src$ ./sync.sh
Starting python evironment...
Loading environment...
Old token still valid
Syncing with Strava...
Fetched 5 strava activities...
Adding 5 activities to database.
Fetched 1 strava activities...
Already in database, skipping...
No more activities to sync.
What sports did you do on Sunday 2026-10-04?

What sports did you do on Monday 2026-10-05?
climb
What sports did you do on Tuesday 2026-10-06?
climb
What sports did you do on Wednesday 2026-10-07?

What sports did you do on Thursday 2026-10-08?

What sports did you do on Friday 2026-10-09?
climb
What sports did you do on Saturday 2026-10-10?

What sports did you do on Sunday 2026-10-11?

Adding 3 activities to database.
Activities table updated.
Daily fitness table updated.
Fitness, fatigue and form values calculated.
Database updated.
Please go to grafana server to visualize data: localhost:3000
From this terminal excerpt, you can see that sync.sh first fetches the authentication token, and checks if it’s still valid. Then, it runs run_sync.py which calls everything else, and contained within this is the API call, reads and writes to the database tables, fitness calculations and parsing and addition of the generic activities. This should result in a table that looks a little something like this. Filling the full table requires running sync.sh history and this should handle populating the table with every activity you have on Strava.
mysql> select * from activities order by date desc limit 15;
+------+-------------+-------+------------+-------------+----------+-----------+-----------+-------+-------+--------+
| id   | sid         | type  | date       | moving_time | distance | elevation | avg_speed | avgHR | maxHR | stress |
+------+-------------+-------+------------+-------------+----------+-----------+-----------+-------+-------+--------+
| 3897 | 20544381012 | Run   | 2026-10-11 |        2267 |     8551 |     101.3 |     3.772 |   177 |   194 |    102 |
| 3896 | 20523685300 | Run   | 2026-10-10 |        3759 |    11574 |      34.7 |     3.079 |   143 |   165 |     24 |
| 3900 |        NULL | Climb | 2026-10-09 |        7200 |     NULL |      NULL |      NULL |  NULL |  NULL |     20 |
| 3895 | 20499484736 | Run   | 2026-10-08 |        3956 |    10108 |      84.6 |     2.555 |   127 |   156 |     14 |
| 3894 | 20493510627 | Run   | 2026-10-07 |        2935 |     9383 |         0 |     3.197 |   161 |   188 |     65 |
| 3899 |        NULL | Climb | 2026-10-06 |        7200 |     NULL |      NULL |      NULL |  NULL |  NULL |     20 |
| 3898 |        NULL | Climb | 2026-10-05 |        7200 |     NULL |      NULL |      NULL |  NULL |  NULL |     20 |
| 3889 | 20443716973 | Run   | 2026-10-04 |        7496 |    22786 |     189.1 |      3.04 |   137 |   154 |     36 |
| 3888 | 20403361999 | Run   | 2026-10-01 |        3436 |     8414 |       100 |     2.449 |   133 |   146 |     13 |
| 3887 | 20397215659 | Run   | 2026-09-30 |        3461 |    10684 |         9 |     3.087 |   142 |   171 |     28 |
| 3886 | 20348551697 | Run   | 2026-09-27 |        4847 |    14200 |     280.7 |      2.93 |   146 |   168 |     47 |
| 3885 | 20336167513 | Ride  | 2026-09-26 |        8180 |  59245.2 |       591 |     7.243 |   133 |   176 |     55 |
| 3884 | 20313482206 | Run   | 2026-09-24 |        3840 |    11945 |      93.7 |     3.111 |   140 |   155 |     20 |
| 3883 | 20300654085 | Run   | 2026-09-23 |        4858 |    16256 |      68.1 |     3.346 |   116 |   175 |     36 |
| 3882 | 20237016817 | Run   | 2026-09-19 |        5167 |    15434 |      93.2 |     2.987 |   134 |   159 |     21 |
+------+-------------+-------+------------+-------------+----------+-----------+-----------+-------+-------+--------+
Grafana
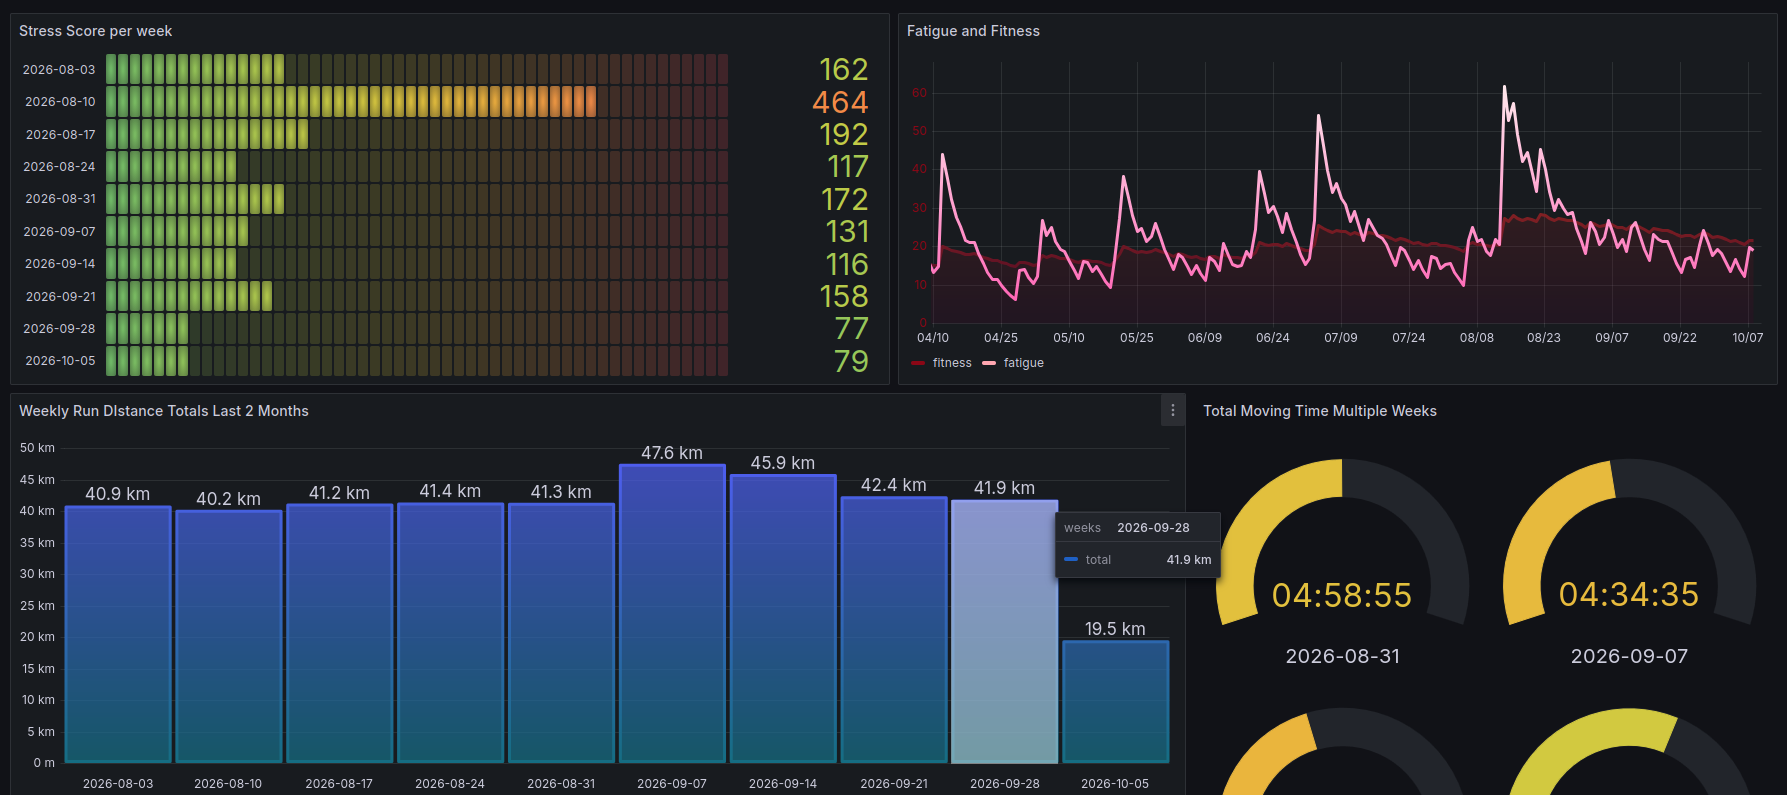
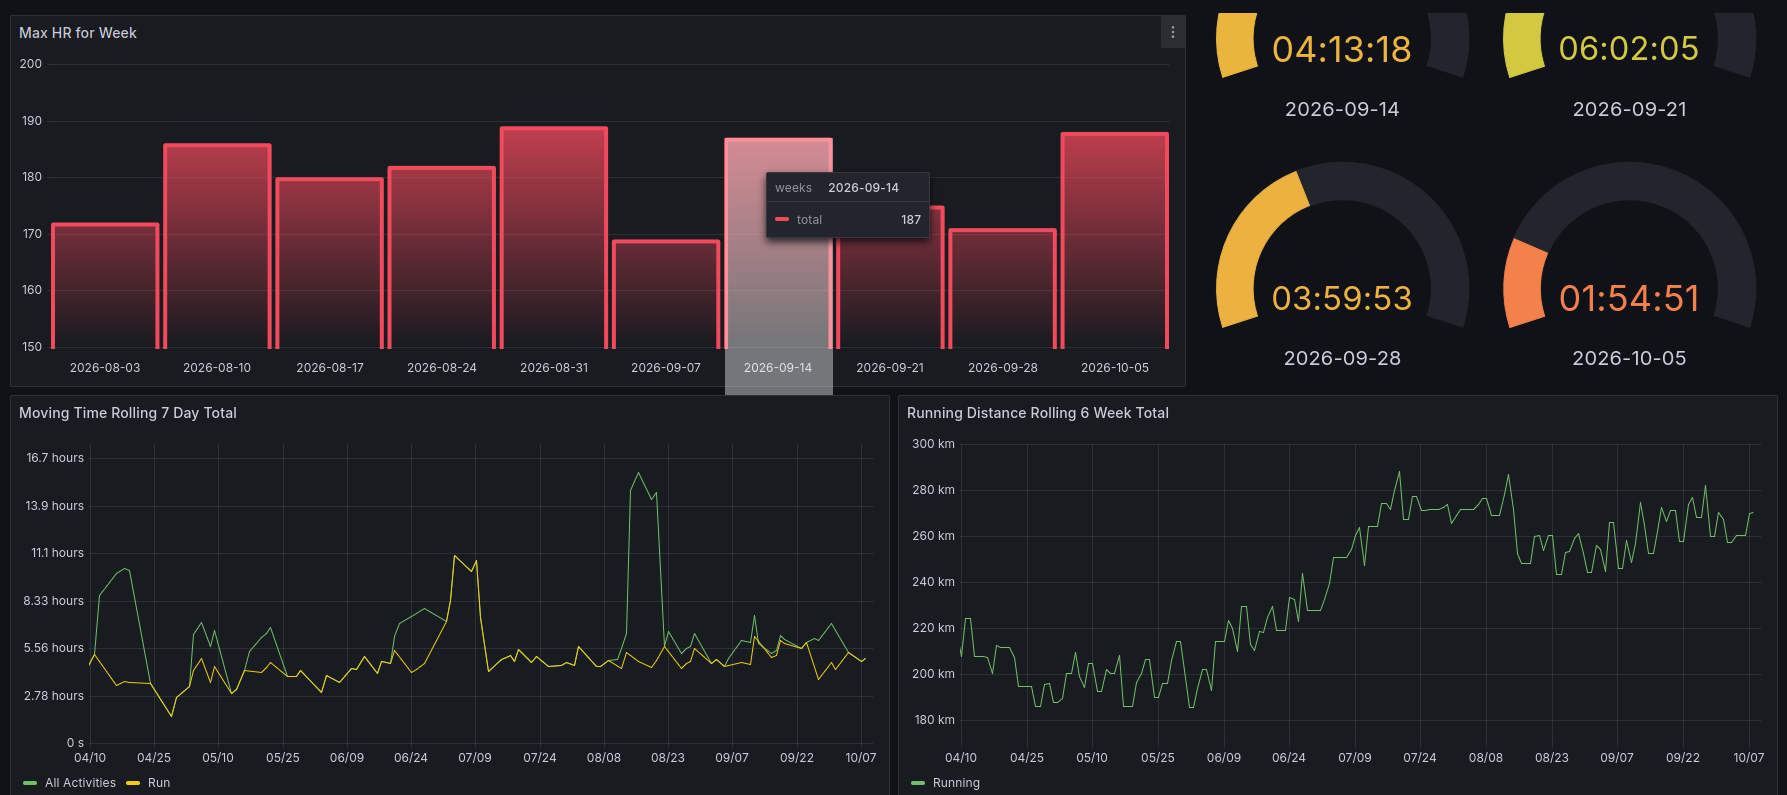
As mentioned in the preamble, I had mostly circumstantial reasons for using Grafana, but it’s a strikingly useful tool. This is where you can really have fun and personalise what you want to see. I chose a few visualisations that I knew I wish I could see on the Strava app. The first is my max heartrate across an entire week for any given week. This doesn’t sound to uesful, but actually, common endurance training logic suggests that having one deload week (where there is less volume and less intensity) out of every four is highly beneficial for absorbing training stress. A rest week, as its known. So knowing if you’ve managed to keep your heart rate low all week is actually very helpful. Another useful visualisation is a rolling six week running distance average or total. This is a great way to spot if your run mileage is increasing too quickly (a very common way of getting yourself injured - I could talk for hours about training methodology but that would be a seperate blog in itself).
To visualise these is where the SQL comes in. In the repo I have included a dashboard file and instructions on using it for a premade set of visualisations. To customise it with your own style, and or data queries is fairly straight forward though and I would recommend giving it a go if you know a little bit of SQL. For example, my query for my max heart rate each week for the last nine weeks displayed as a bar chart is:
with data as (select date,distance,moving_time,avgHR,maxHR from activities where type="Run" order by date)
select DATE_FORMAT(ADDDATE(date, INTERVAL -WEEKDAY(date) DAY), '%Y-%m-%d') as weeks,
max(maxHR) as total from data where date > date_format(ADDDATE(current_date, INTERVAL -(63+WEEKDAY(current_date)) DAY),"%Y-%m-%d") group by weeks order by weeks;
If you don’t know much about SQL then feel free to use any number of commercially available coding agents and LLMs, which will also do a very good job of making these commands for you. I’ve come to realise that one of the other benefits to using Grafana is that it becomes highly customisable and excessible, where you only need to know a little SQL to make a great visualisation, rather than have to vibe code an entire web interface yourself.
Et Viola!
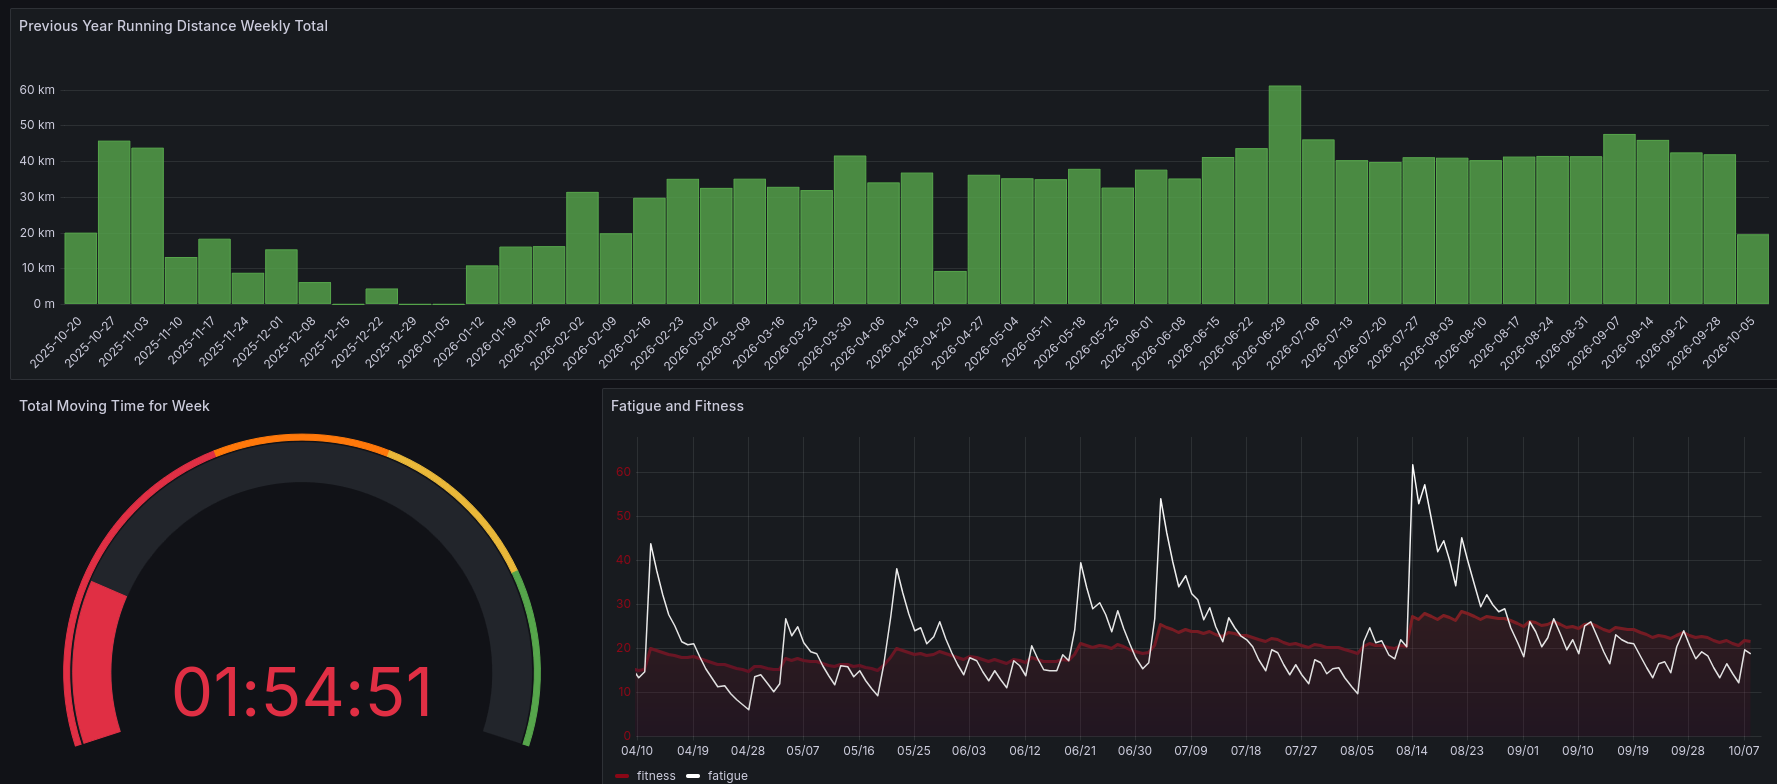
And finally, going to a browser and using the port of Grafana (3000 by default), you can see as much or as little of your training data as your heart desires. This is my current dashboard (and the one saved in the repo, so you can have a go too).
What’s next?
The obvious things to tackle next are as follows:
- Testing and documentation - really no excuse for this not being there in the age of coding agents. I just need to sit down and do it.
- Other time series data - I’ve always thought plotting transaction histories from your bank might be interesting, to see it rise and fall as money enters and leaves an account.
- Maybe some actual running? - One could argue that spending more time running and less time programming this would have been more beneficial from a training perspective, but who’s to say?
If you made it this far, then thank you very much for endulging me and my project. If you have any questions, please let me know via an issue on the GitHub page. If not, have a wonderful day and keep checking in with this blog, hopefully I’ll find time to post about a few more things soon.
>quit
Bye.